


measurements, so that the amount of information needed to pick out a single arrangement is essentially the length in digits of one such number.
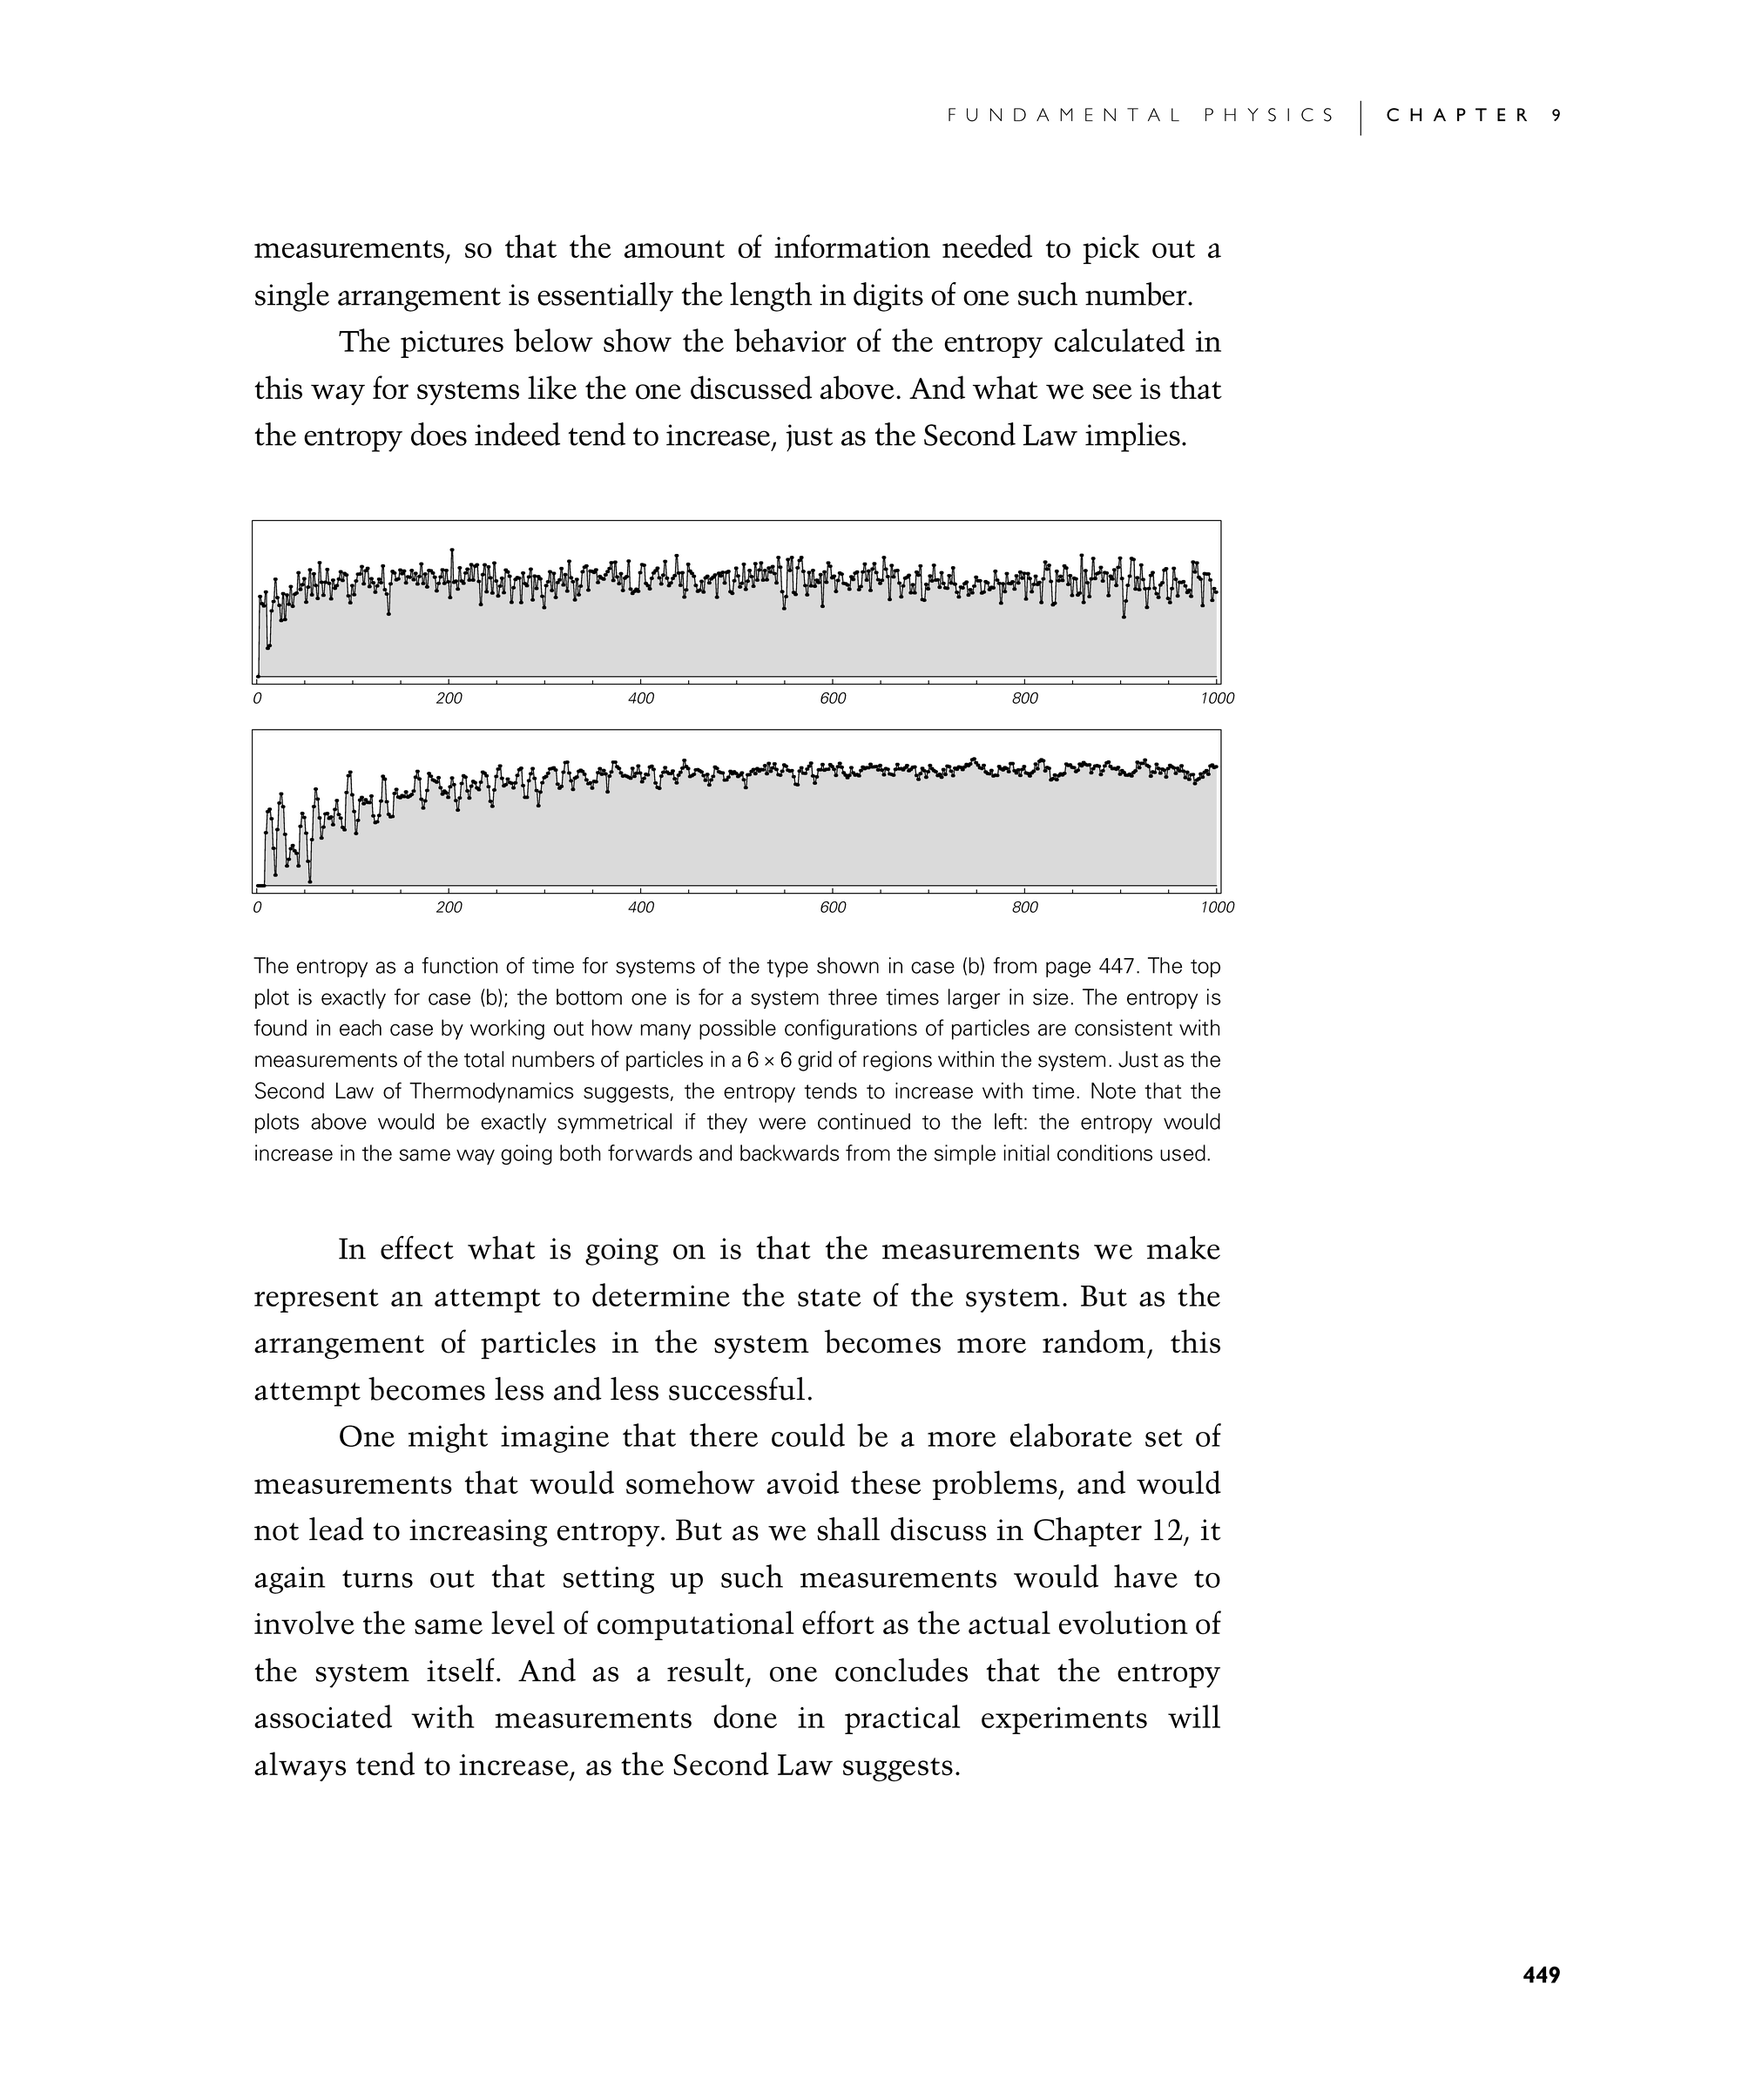
The pictures below show the behavior of the entropy calculated in this way for systems like the one discussed above. And what we see is that the entropy does indeed tend to increase, just as the Second Law implies.
In effect what is going on is that the measurements we make represent an attempt to determine the state of the system. But as the arrangement of particles in the system becomes more random, this attempt becomes less and less successful.
One might imagine that there could be a more elaborate set of measurements that would somehow avoid these problems, and would not lead to increasing entropy. But as we shall discuss in Chapter 12, it again turns out that setting up such measurements would have to involve the same level of computational effort as the actual evolution of the system itself. And as a result, one concludes that the entropy associated with measurements done in practical experiments will always tend to increase, as the Second Law suggests.
The entropy as a function of time for systems of the type shown in case (b) from page 447. The top plot is exactly for case (b); the bottom one is for a system three times larger in size. The entropy is found in each case by working out how many possible configurations of particles are consistent with measurements of the total numbers of particles in a 6×6 grid of regions within the system. Just as the Second Law of Thermodynamics suggests, the entropy tends to increase with time. Note that the plots above would be exactly symmetrical if they were continued to the left: the entropy would increase in the same way going both forwards and backwards from the simple initial conditions used.