
There are in general two ways in which data can be reduced by perception and analysis. First, those aspects of data that are not relevant for whatever purpose one has can simply be ignored. And second, one can avoid explicitly having to specify every element in the data by making use of regularities that one sees.
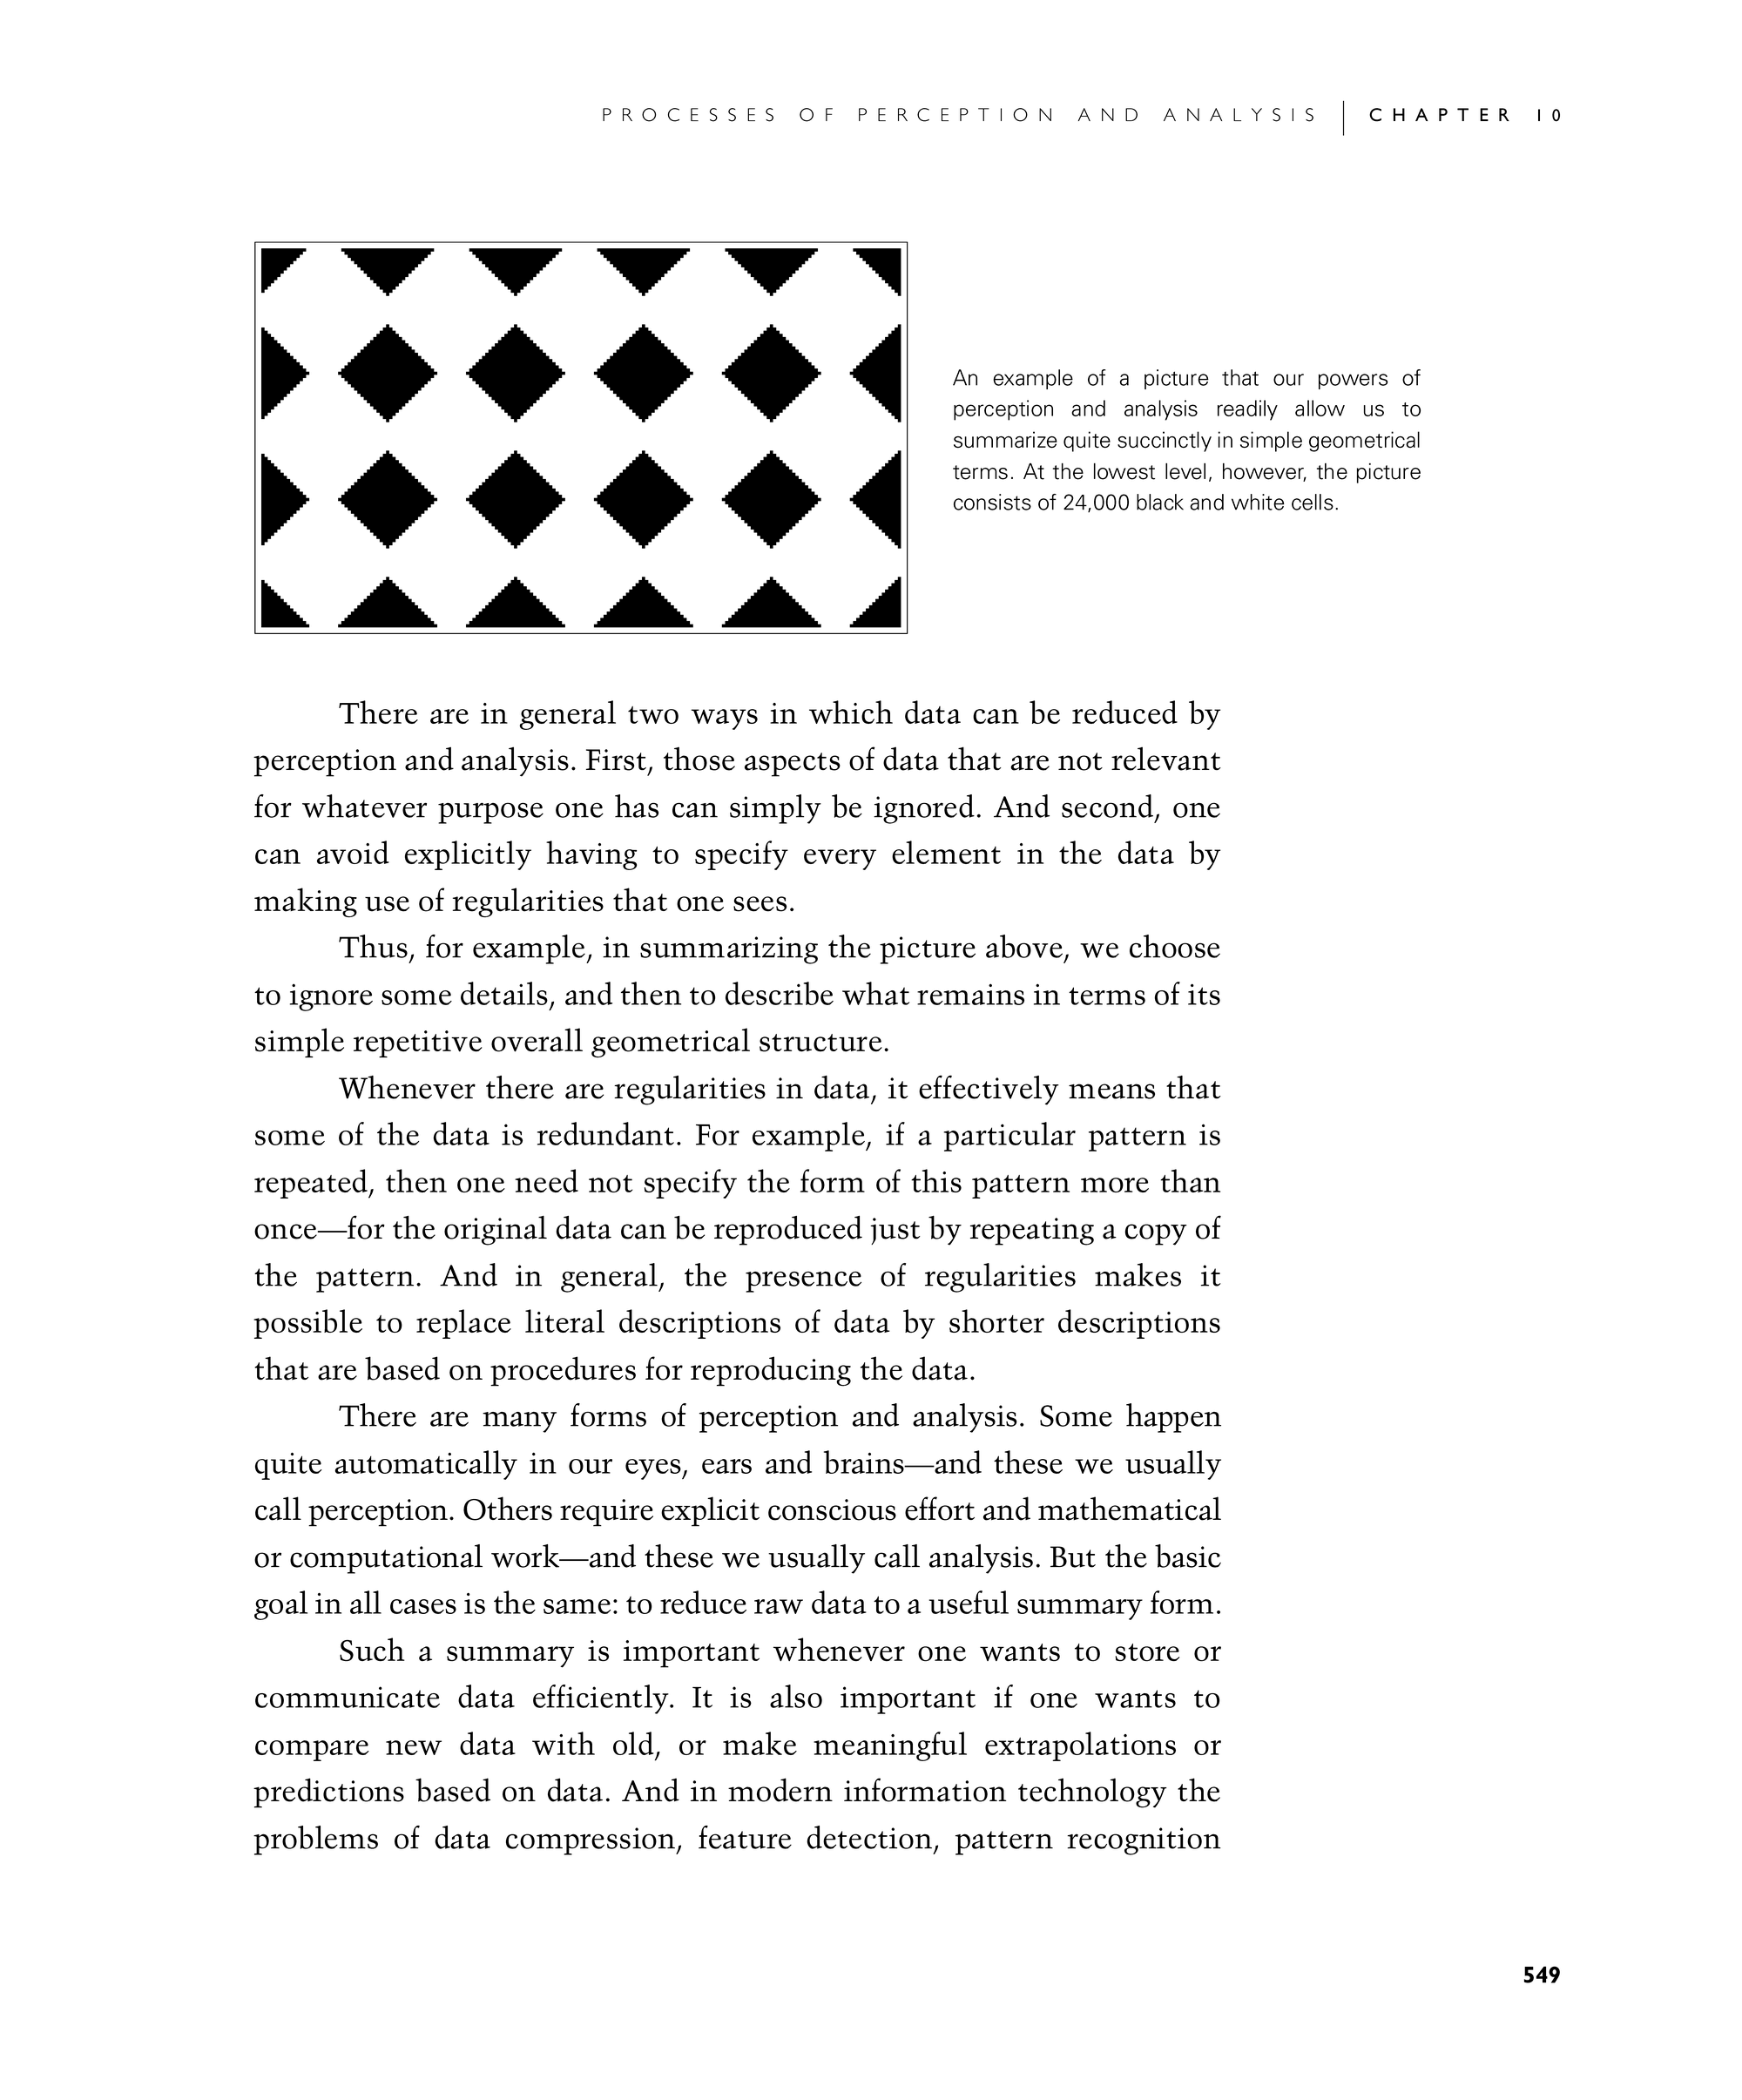
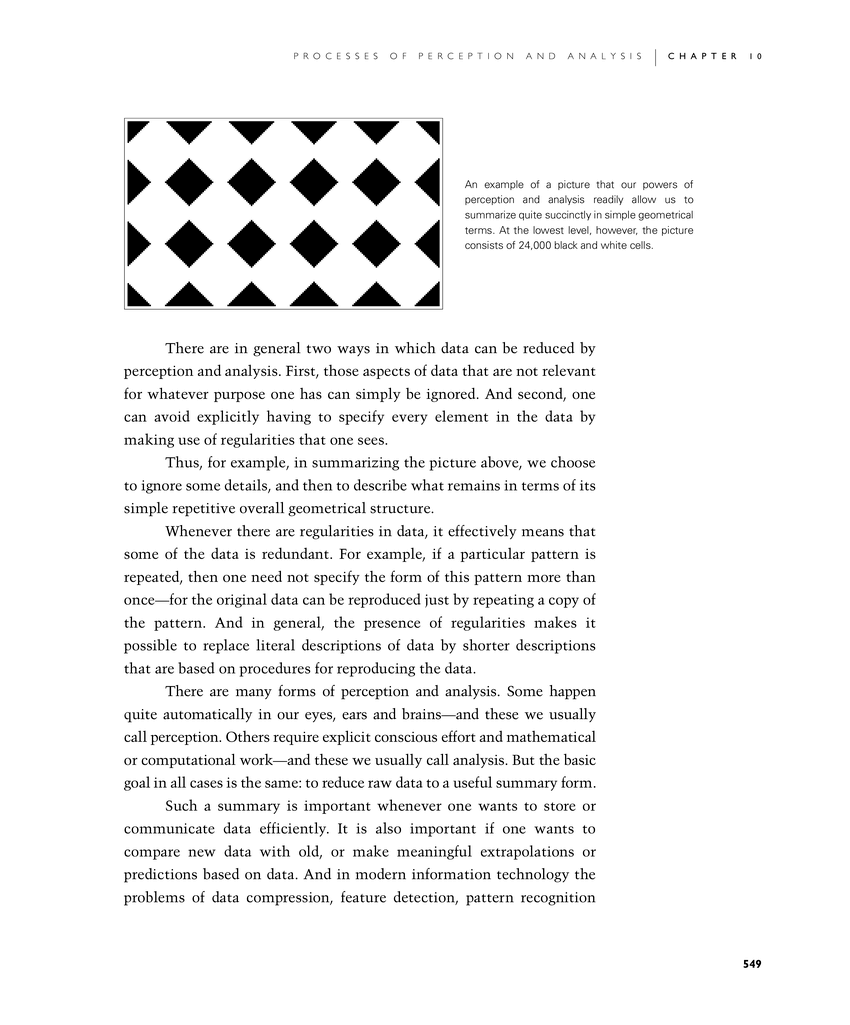
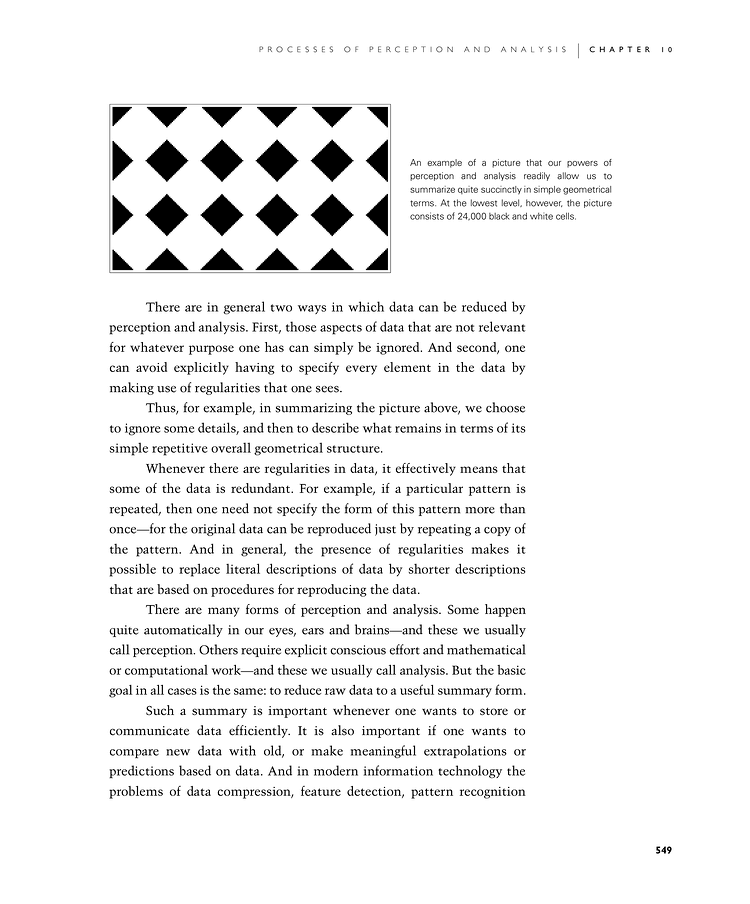
Thus, for example, in summarizing the picture below, we choose to ignore some details, and then to describe what remains in terms of its simple repetitive overall geometrical structure.
Whenever there are regularities in data, it effectively means that some of the data is redundant. For example, if a particular pattern is repeated, then one need not specify the form of this pattern more than once—for the original data can be reproduced just by repeating a copy of the pattern. And in general, the presence of regularities makes it possible to replace literal descriptions of data by shorter descriptions that are based on procedures for reproducing the data.
There are many forms of perception and analysis. Some happen quite automatically in our eyes, ears and brains—and these we usually call perception. Others require explicit conscious effort and mathematical or computational work—and these we usually call analysis. But the basic goal in all cases is the same: to reduce raw data to a useful summary form.
Such a summary is important whenever one wants to store or communicate data efficiently. It is also important if one wants to compare new data with old, or make meaningful extrapolations or predictions based on data. And in modern information technology the problems of data compression, feature detection, pattern recognition
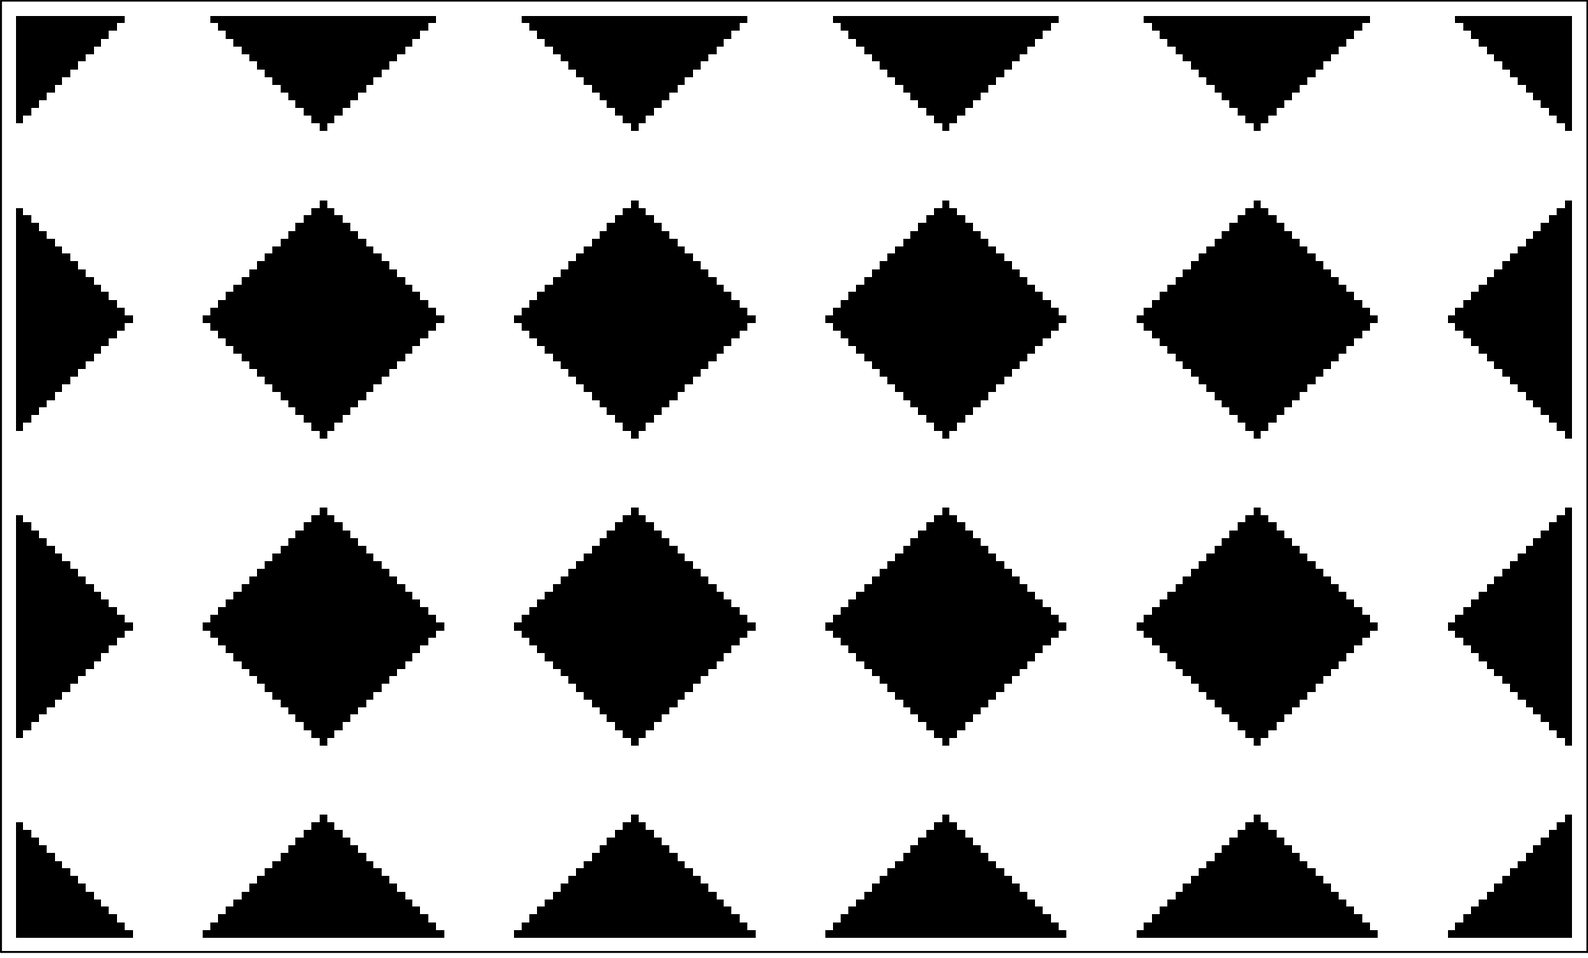
An example of a picture that our powers of perception and analysis readily allow us to summarize quite succinctly in simple geometrical terms. At the lowest level, however, the picture consists of 24,000 black and white cells.