


 |  |
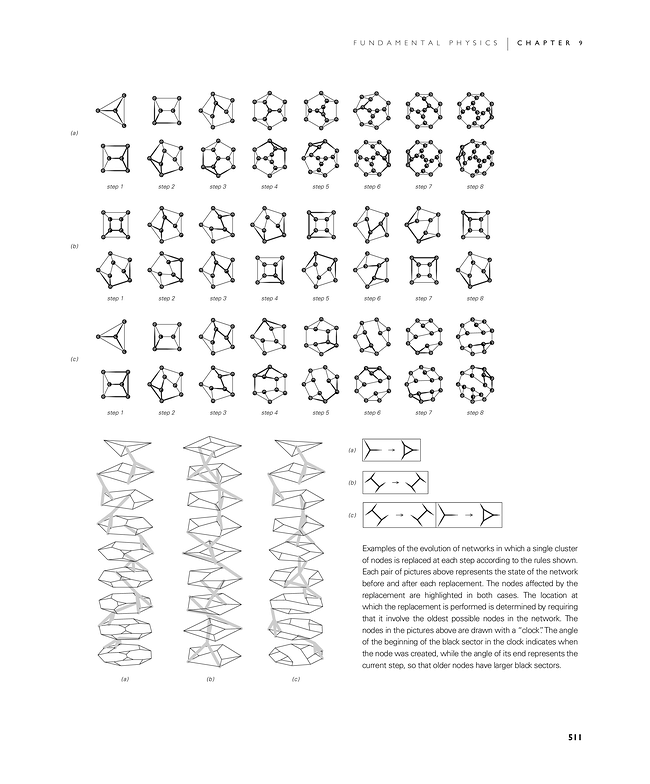
Examples of the evolution of networks in which a single cluster of nodes is replaced at each step according to the rules shown. Each pair of pictures above represents the state of the network before and after each replacement. The nodes affected by the replacement are highlighted in both cases. The location at which the replacement is performed is determined by requiring that it involve the oldest possible nodes in the network. The nodes in the pictures above are drawn with a "clock". The angle of the beginning of the black sector in the clock indicates when the node was created, while the angle of its end represents the current step, so that older nodes have larger black sectors.