

so long as the structure of the network is kept the same, it is fairly easy even in this case to deduce from a given set of data what probabilities in the network provide the best model for the data—for essentially all one need do is to follow the path corresponding to the data, and see with what frequency each connection from each node ends up being used.
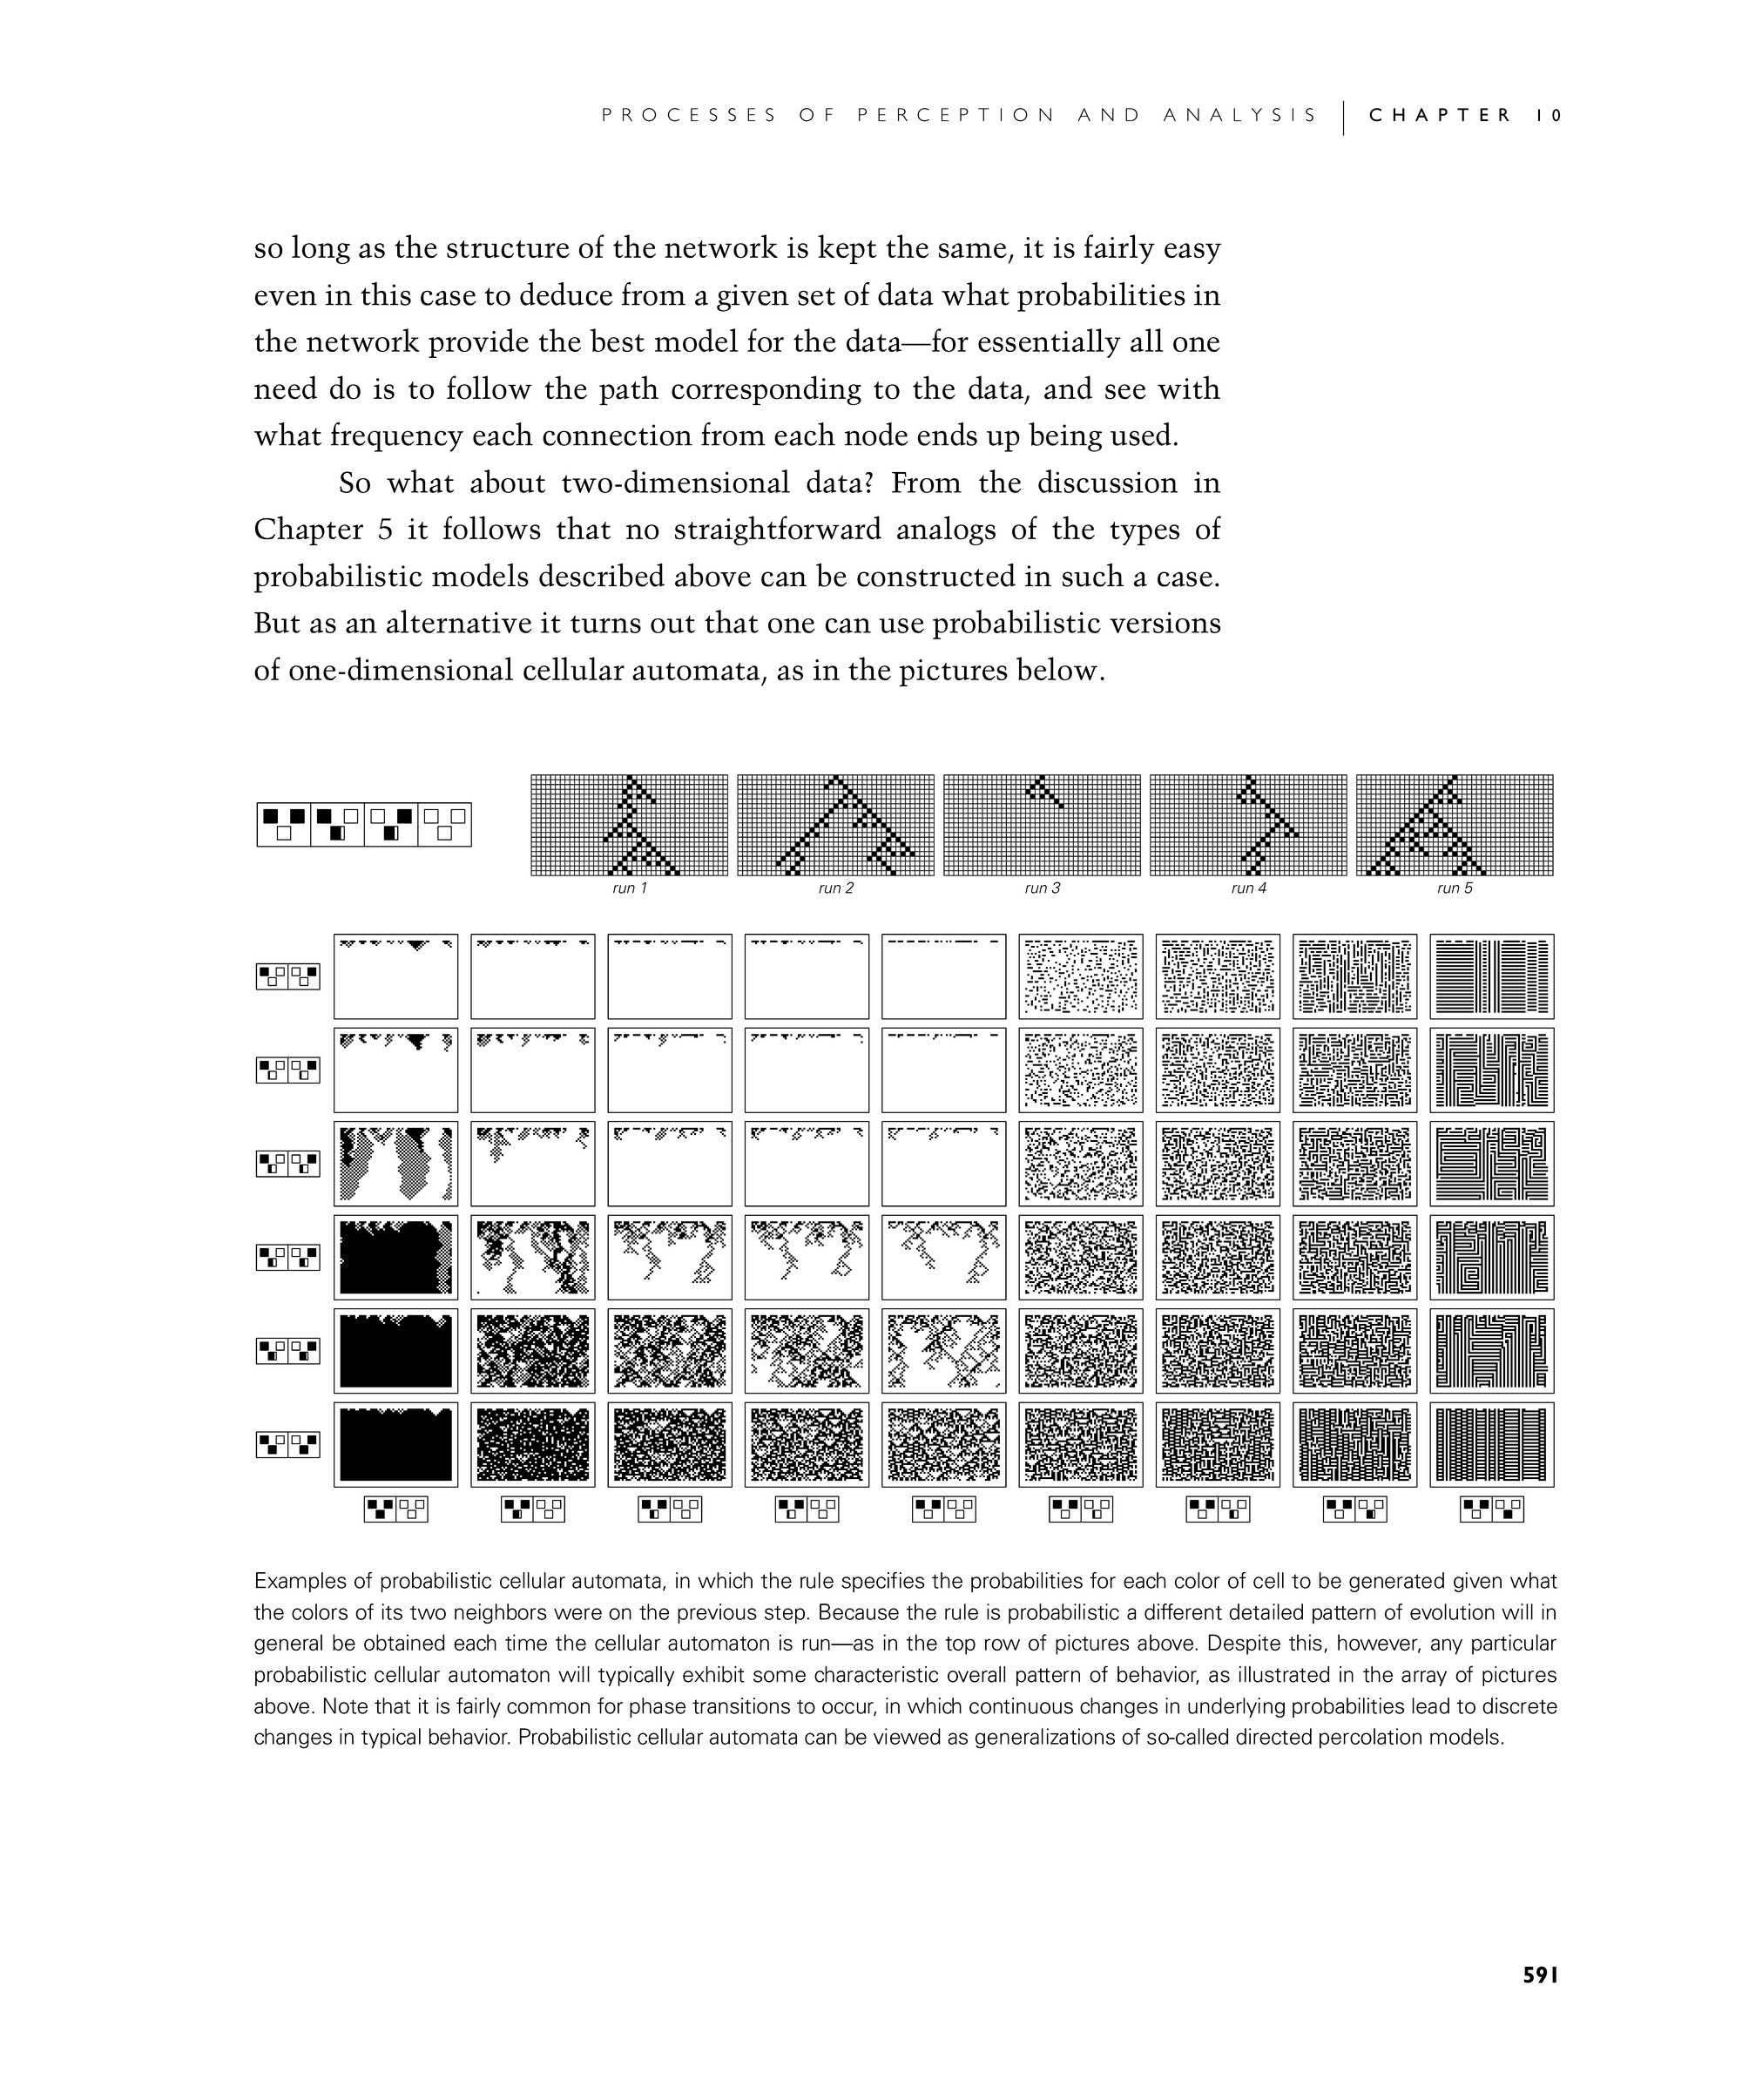
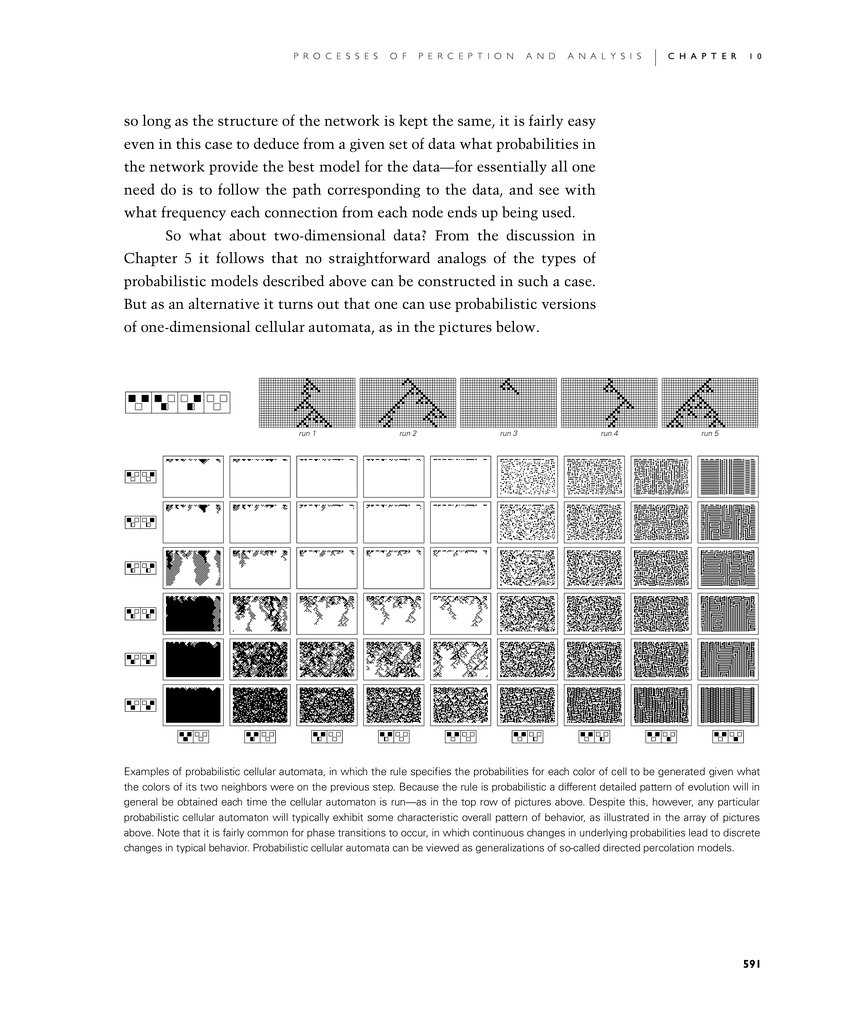
So what about two-dimensional data? From the discussion in Chapter 5 it follows that no straightforward analogs of the types of probabilistic models described above can be constructed in such a case. But as an alternative it turns out that one can use probabilistic versions of one-dimensional cellular automata, as in the pictures below.
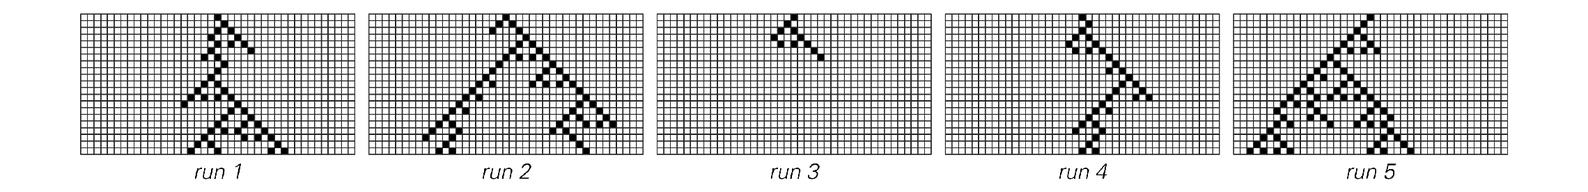 |
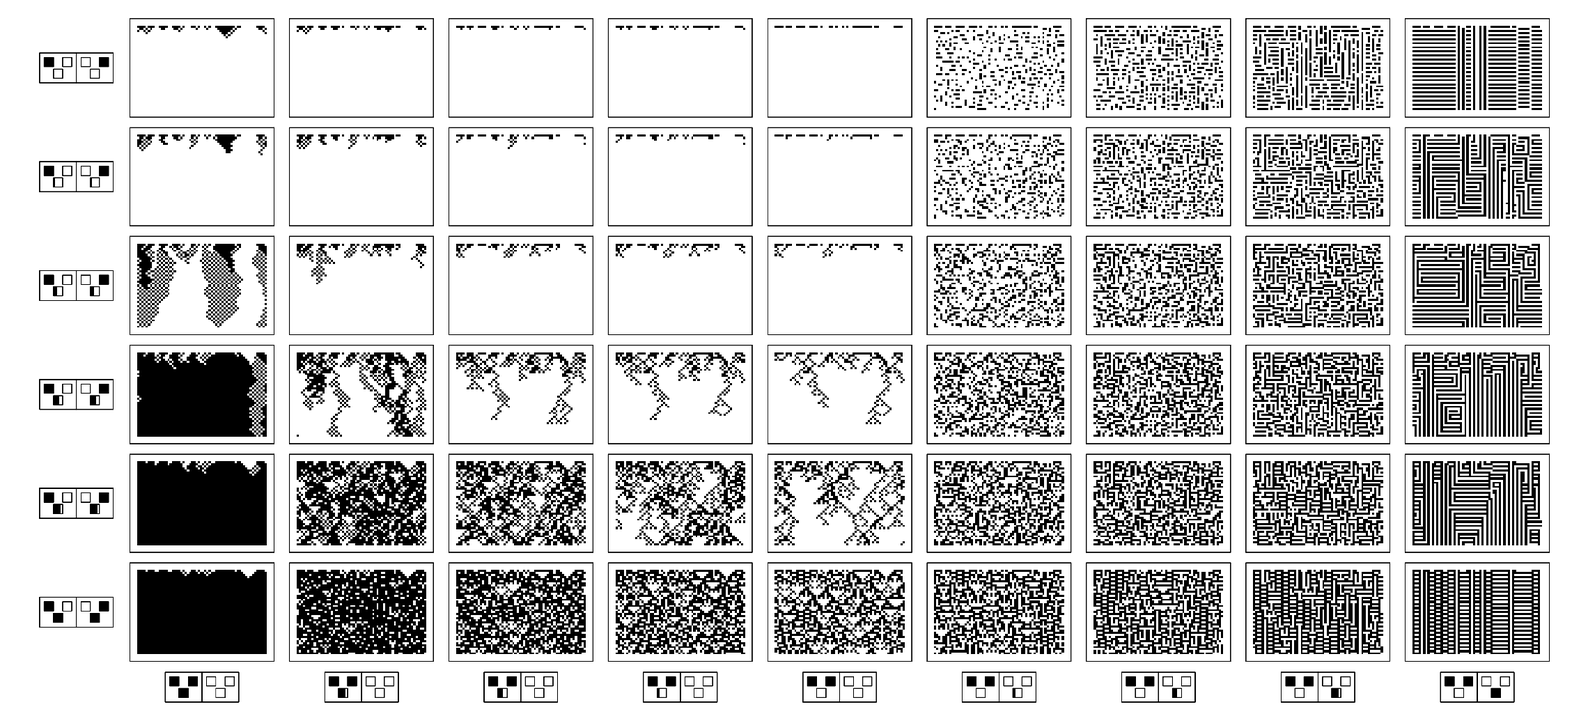
Examples of probabilistic cellular automata, in which the rule specifies the probabilities for each color of cell to be generated given what the colors of its two neighbors were on the previous step. Because the rule is probabilistic a different detailed pattern of evolution will in general be obtained each time the cellular automaton is run—as in the top row of pictures above. Despite this, however, any particular probabilistic cellular automaton will typically exhibit some characteristic overall pattern of behavior, as illustrated in the array of pictures above. Note that it is fairly common for phase transitions to occur, in which continuous changes in underlying probabilities lead to discrete changes in typical behavior. Probabilistic cellular automata can be viewed as generalizations of so-called directed percolation models.