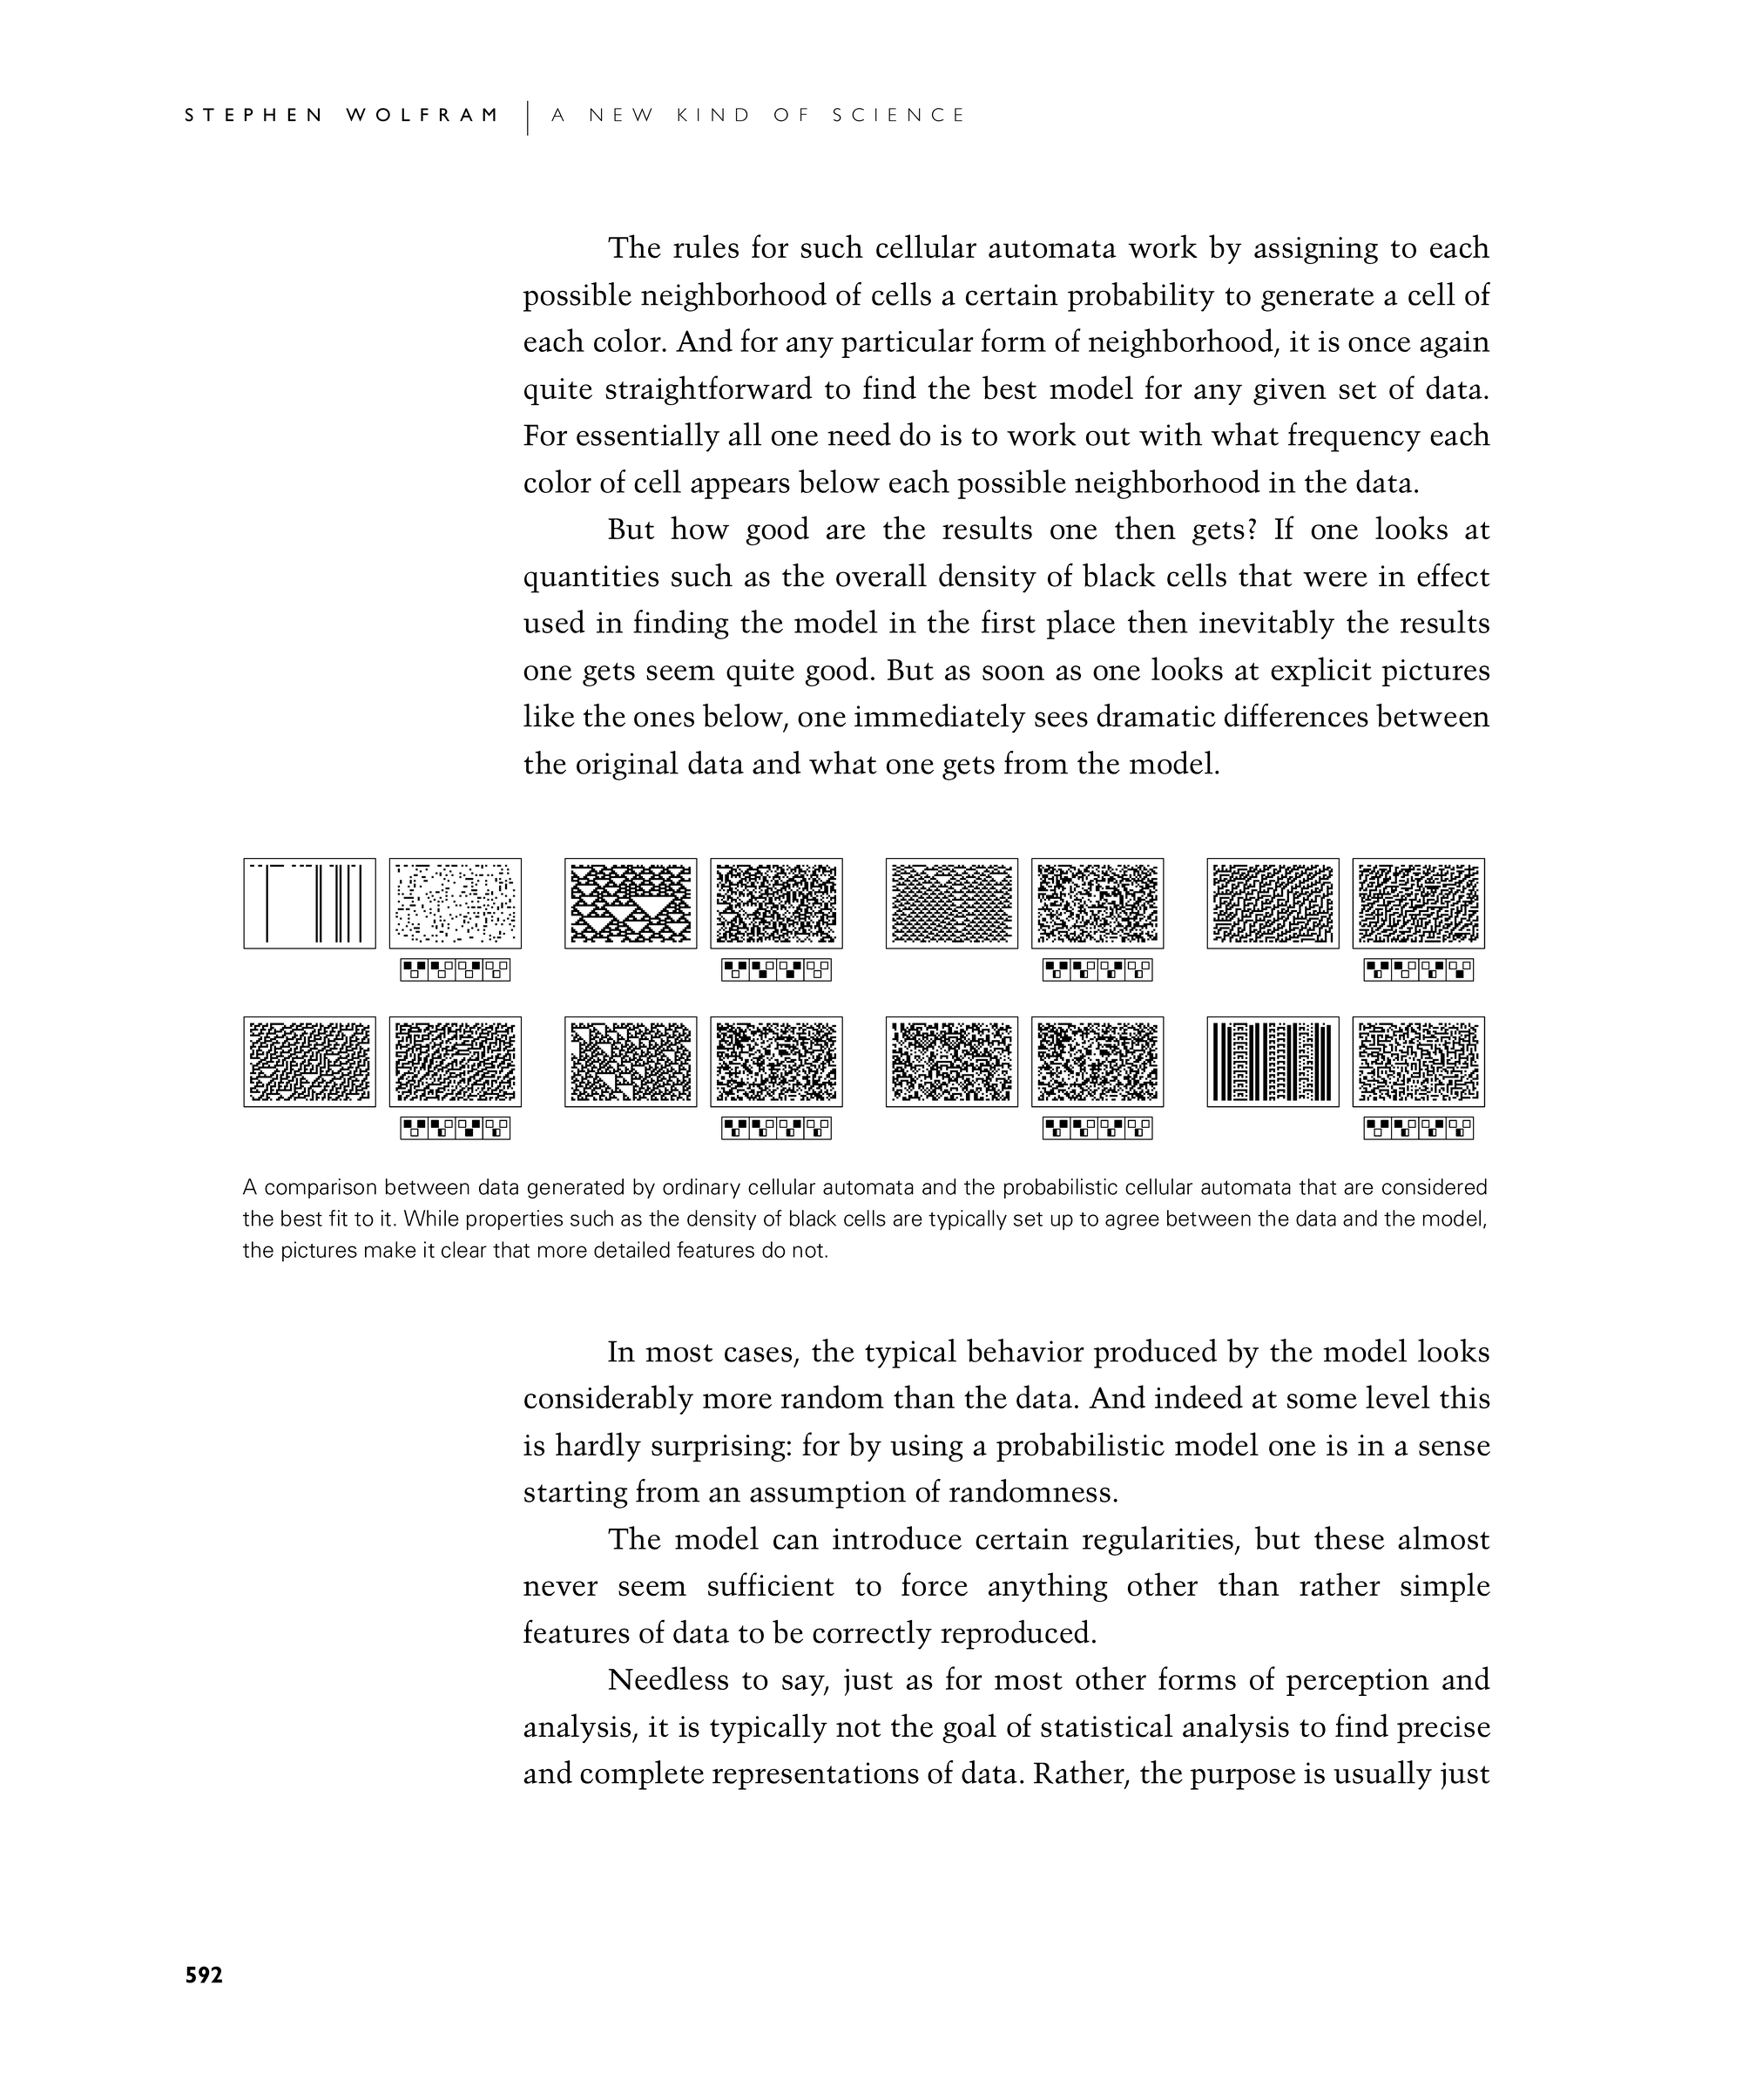
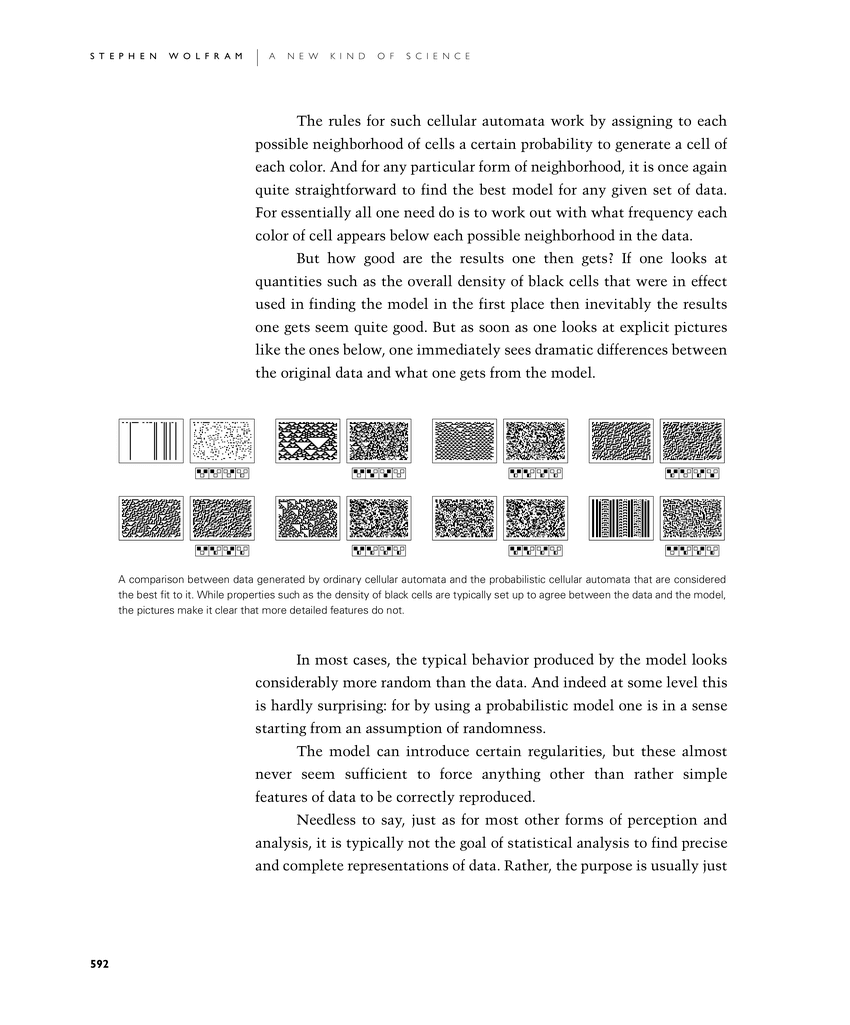


The rules for such cellular automata work by assigning to each possible neighborhood of cells a certain probability to generate a cell of each color. And for any particular form of neighborhood, it is once again quite straightforward to find the best model for any given set of data. For essentially all one need do is to work out with what frequency each color of cell appears below each possible neighborhood in the data.
But how good are the results one then gets? If one looks at quantities such as the overall density of black cells that were in effect used in finding the model in the first place then inevitably the results one gets seem quite good. But as soon as one looks at explicit pictures like the ones below, one immediately sees dramatic differences between the original data and what one gets from the model.
In most cases, the typical behavior produced by the model looks considerably more random than the data. And indeed at some level this is hardly surprising: for by using a probabilistic model one is in a sense starting from an assumption of randomness.
The model can introduce certain regularities, but these almost never seem sufficient to force anything other than rather simple features of data to be correctly reproduced.
Needless to say, just as for most other forms of perception and analysis, it is typically not the goal of statistical analysis to find precise and complete representations of data. Rather, the purpose is usually just
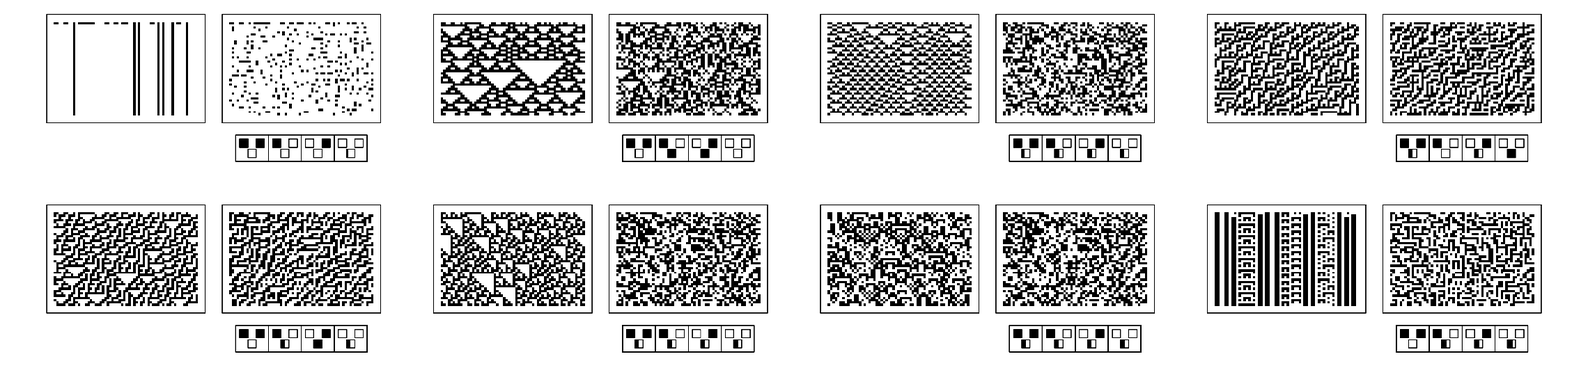
A comparison between data generated by ordinary cellular automata and the probabilistic cellular automata that are considered the best fit to it. While properties such as the density of black cells are typically set up to agree between the data and the model, the pictures make it clear that more detailed features do not.